

UNI, the token of UNISWAP, has now been stuck around its all-time high (ATH) as an investor response to the weakening crypto market, so the bullish outlook is still in the spotlight of the market in terms of technical factors which we will discuss.
Now, based on data from CoinMarketCap (CMC), at the time of writing, UNI has a market capitalization of $21,472,039,380 and a daily trading volume of $759,506,062 which makes this crypto ranked 11th in terms of market capitalization. And if we compare it to last week, market capitalization and transaction volume have increased as confidence in the market has returned, especially in DeFi.
4 Hour Chart Technical
At the time of writing, UNI has established a new ATH level around $44 with quite a strong and pressing advance, whereas recently, the price is again facing selling pressure which we need to see as a correction/pullback as the price structure still looks reassuring in my analysis.
In my technical view, the bulls still have the potential to dominate again in the long term, because aside from the on-bullish technical structure, UNI’s fundamentals will still be positive due to strong market interest in DeFi.
Here I try to describe it in the 4-hour technical chart below:
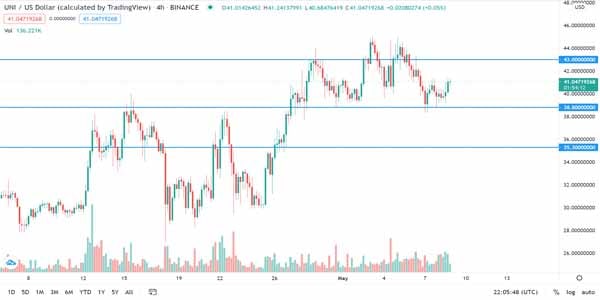
Based on the picture above, the price that has fallen from its ATH level is still unable to form a new Low level which indicates that Bullish domination still accompanies the UNI token.
In my view, at this time frame, UNI has a Key Support-Resistance (SR) level that is capable enough for us to use as a handle in validating potential trends, namely at the levels of $ 35.30, $ 38.80 and $ 43.
In this analysis, support at $ 38.80 is the key to validating the trend, which I see, the bulls will still have the potential as long as this level has not been broken down strongly.
Daily Chart Technical:
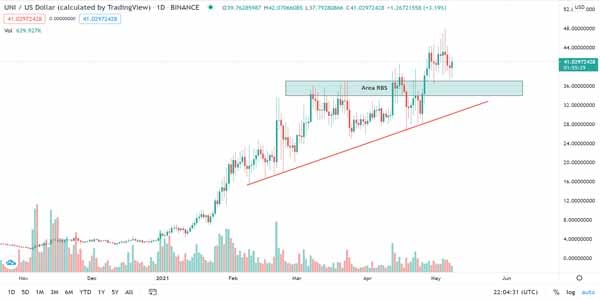
Also, in the medium-term view, this UNISWAP token still has the previous Resistance Area Become Support (Area Resistance Become Support, RBS) as a basis for analysis, where this RBS Area will become a ‘Wall of Defense’ for Bullish potential working together with the Red Up Trendline.
In view of this analysis, the Red Uptrend Line has also become a Bullish basis, so it will remain the main ‘validator’ of the Bullish scheme along with the RBS Area, while still observing technical movements at lower Time Frames to anticipate all possibilities earlier.
And for the Bearish scheme, the price continues to fall strongly which was started by breaking down the Key Support on the 4-hour chart and also the RBS Area as a reinforcing signal that the Bears are trying to dominate again.
And for the fundamental view, the latest recovery of DeFi tokens is caused by investors’ concerns starting to subside after Biden’s tax policy, so the Bullish still looks strong to continue, where strong DeFi support will also remain the basis of UNI token Green potential.
(*)