

ETH, a major altcoin, is still in a strong bullish price structure after continuing its main rally by printing a new ATH so far, which looks like it won’t be stopping anytime soon!
Now, based on data from Coin Market Cap (CMC), at the time of writing, ETH has a market capitalization of $397,383,787,568 and a daily trading volume of $49,208,300,610 which makes this crypto ranked 2nd in terms of market capitalization. And if we compare it to 2020, the market cap has seen a very rapid rise as new investor interest in mainstream crypto, including Altcoins, has increased.
4 Hour Chart Technical
At the time of writing, Ethereum (ETH) has printed new ATHs in the $3,400 range at the time of writing, indicating strong institutional interest has lifted the crypto to new highs and continues to climb so even FOMO retail seems to have stepped in as well.
In our technical view, the bulls still hold dominance as long as they haven’t formed a weakening green bullish candle so that the market is optimistic in being measured from here, of course technically.
Here I try to describe it in the 4-hour technical chart below:
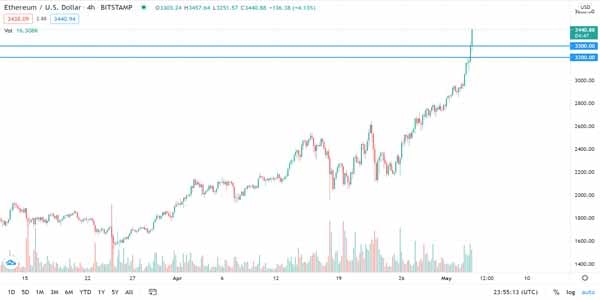
Based on the image above, the price is in a very capable bullish structure after forming a new ATH above the $3,000 level which is the main psychic level for investors, so a simple analysis can be formed based on the current price structure.
In my view, in this time frame, we will observe how investors respond to each ATH level that is formed while still being wary of Pullback actions due to several Take Profit attempts, so we have Key Support levels at $ 3,200 and $ 3,300 which are the basis for Bullish potential during the price is still able to be above these levels.
A break or rejection of the Support level (if a retest occurs) will become a technical foundation that is sufficiently qualified to clearly signal the next trend, where there is a possibility that Support will not be touched if investor interest is still high.
Daily Chart Technical:
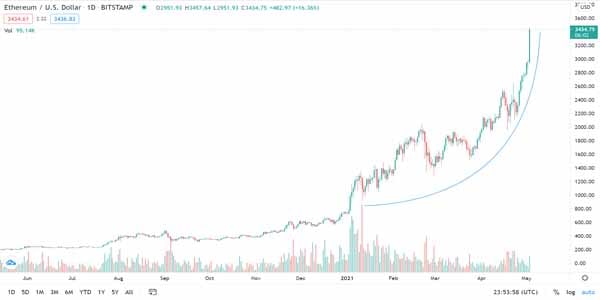
Also, in the medium-term view, the Ethereum token also looks very bullish in its rally pattern, so in an optimistic view, the sell-off is likely to form only a correction or a pullback in the next few days. The new potential ATH I think the closest will be to $3,500, then to $4,000.
In view of this analysis, the main levels for validation are the $3,200, $3,300 and $3,400 levels, all of which are Multi-Day psychological levels that we can use to gauge the strength of the market outlook if one of these levels is tested.
Apart from that, in a bullish view, we also mapped the rally line which serves to measure how strong the potential for a rally is if the price tries to approach it.
And for the Bearish scheme, it is still rather unlikely for the next few days, which will only occur if the conditions on the 4-hour chart occur, i.e. price breaks strongly the $3,200 Support level and is in large volume support.
And from a fundamental viewpoint, ETH’s rise is the fruit of increasing institutional and retail interest in the positive developments on the Ethereum network, which include increasing interest in DeFi being on the network.
(*)