

LINK is now forming a fairly strong decline from its daily peak which is forming a potential new Higher Low level in our technical base.
Now, based on data from CoinMarketCap (CMC), at the time of writing, Chainlink (LINK) has a market cap of $14,438,257,590 and a daily trading volume of $3,847,903,967 which makes the crypto 12th in market cap. And if we compare it to 2020, market capitalization has experienced a very rapid increase as new investor interest in Altcoins increases.
4 Hours Technical Chart
At the time of writing, LINK has fallen quite deep from its ATH level which technically, the decline was formed quite intensely as investors were worried about the US government’s actions on crypto so there was certainly an element of panic that hit the Selling action.
In our technical view, Bulls still dominate in terms of price structure, where Higher Low levels are still potentially formed which will be the basis of my analysis for the next few days.
Here I try to describe it in the 4-hour technical chart below:
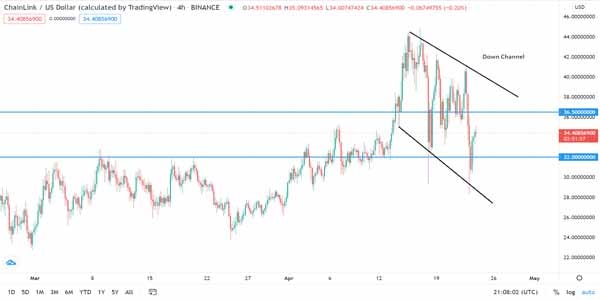
Based on the picture above, the price is in a Down Channel pattern, where in this time frame, the price is forming a new Lower Low level after the Lower High is formed, so in theory, price movements are still in accordance with how the Channel works, so the price still has a bullish opportunity as long as it is still is in this Channel pattern.
In my view, at this time frame, Chainlink (LINK) has a Key Support-Resistance (SR) level that is quite capable for us to use as a handle in validating potential trends, namely at the $32 and $36.50 levels.
A strong break at one of these SR levels, I read, will be a technical foundation that is quite capable of reading which direction the sentiment is taking investors for the LINK token, regardless of the medium-term bullishness.
Daily Graph Technical:
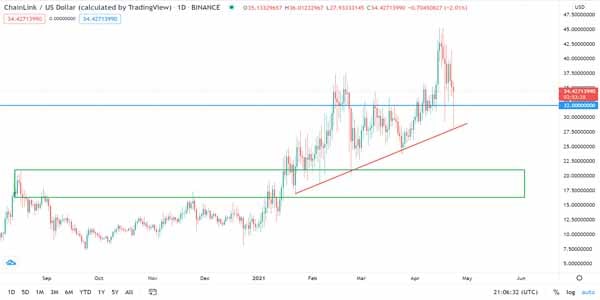
Also, in the medium term view, the Chainlink token at the time of writing is still in a bullish trend, still above the Up Trendline and Daily Key Support, $32 (same as the Support on the 4-hour chart).
In view of this analysis, Daily Key Support will work as a ‘Validator’ of the potential Bullish, in collaboration with Up Trendline to restrain the price from any Seller attempts, which will create a new Higher Low to form the basis of a potential Bullish rally, which becomes a Bullish scheme. which we need to pay close attention to.
And for the Bearish scheme, the price continued to fall strongly and broke the Daily Key Support Level and also the Up Trendline strongly accompanied by higher-than-average volumes, so I think this might also adhere to the fundamental sentiment and rules government in the future, which will either trigger or alleviate concerns.
And for the fundamental view, the decline in recent days is the impact of the US government’s actions that create panic among investors, so of course this cannot be said to be a strong bearish sentiment because globally, crypto has absorbed quite a lot of new investor interest which continues to increase throughout 2021.
(*)