

Ethereum (ETH), which has been moving in a weekly bullish flow, has started to question its potential after the price weakened again and visited the Lower High Zone.
On a macro basis, the Bearish Major still overshadows the second crypto based on this market capitalization. However, the Weekly Bull that has occurred has been built by investor confidence in the advancement of Ethereum network technology in the DeFi sector and also digital finance which cannot be underestimated.
Now, based on data from Coin Market Cap (CMC), ETH has a market capitalization of $19,182,094,878 and a daily trading volume of $21,134,185,500 which still places it as the number two cryptocurrency. However, compared to yesterday, the market capitalization has decreased slightly, but the daily volume has increased, which indicates that there will be a spike in transactions within the Lower High Zone.
Short Term Technicals
At the time of writing, Ethereum has been squeezed quite hard from its weekly tops to have now retested the Green Lower High Zone which we feel is a crucial zone for the next trend.
Structurally, the Lower High Zone was an important point in the past because previously a Bullish Continuation pattern had formed here, so we can read investors’ views psychologically within this Zone for trend clarity.
Here we try to describe it in the 2-hour technical chart below:
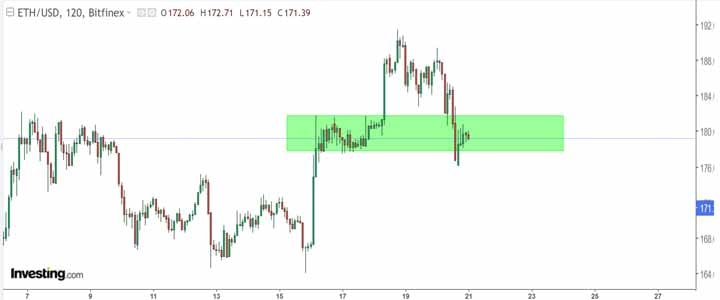
Based on the picture above, as previously described, we see this Lower High Zone as an important technical factor to read the next trend signal, where the loss of buying momentum in this zone will be a catalyst for Short action to pressure prices to form lower levels.
In our view, Bullish or Bearish this week will be determined by signals from price action in the Validation Zone, regardless of the need to anticipate possible ranging movements, or fake movements.
Long Term Technical
On the other hand, in a long-term view, Ethereum is currently on the verge of Validation of the Bullish sentiment a few days ago, which is starting to threaten its existence because the price is still slightly below the Lower High Level of 173.84.
From our point of view, prices that close above or below the Lower High Level will reflect an interesting potential trend to wait and observe, to make sure whether the Bearish Major will still show its strength or not.
Here we try to break it down in the Daily technical chart below:
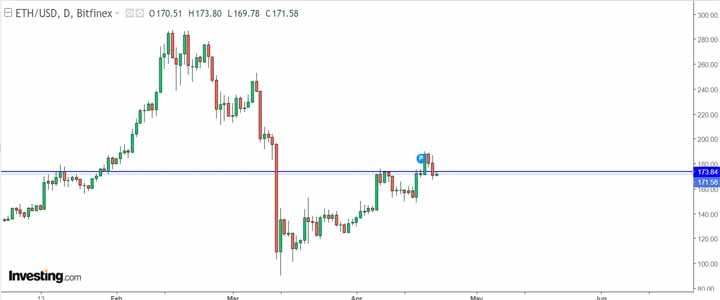
From a macro viewpoint, indeed we see the Lower High Level as potential enough to be used as a benchmark for analysis of whether the bullish impulse will continue or not a few days ago, so we see that it is quite simple and technically clean.
Even though it is necessary to anticipate Bearish schemes, Bullish impulses are still looming because the development of the Ethereum network itself still looks positive in the digital finance and DeFi sectors, but one well-known analyst once said that Ethereum’s performance still depends on the figure of Vitalik Buterin. We’ll see.
(*)