


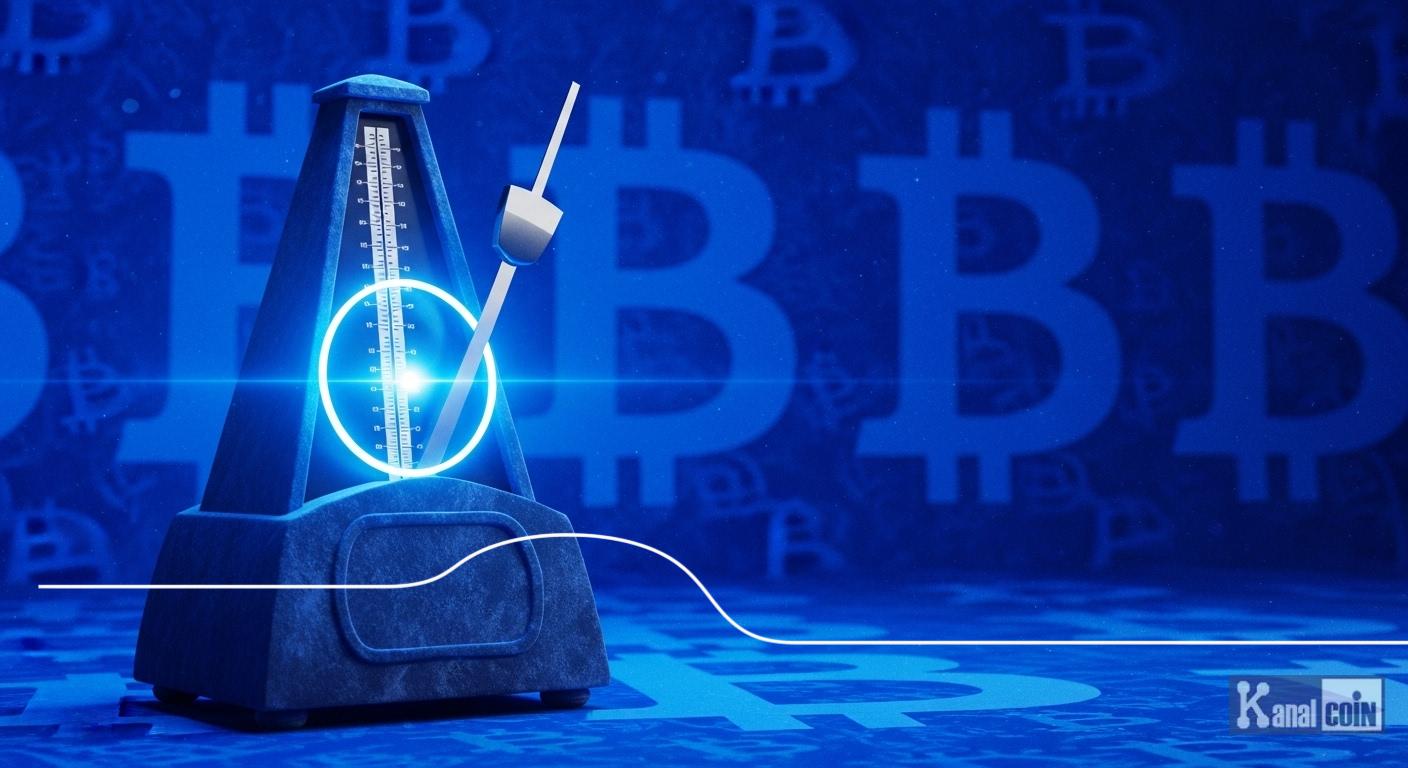
Is the 2026 Bitcoin bottom fractal valid? Plausible, not proven
The “Bitcoin bottom fractal” remains a plausible, but not yet proven, framework in early 2026. The thesis contends that price behavior has already carved out a cyclical low and is setting up for a substantial advance reminiscent of prior post‑halving recoveries, with some proponents citing potential gains around 130%. Historical rhyme is not a guarantee, and the model still requires confirmation.
Validation hinges on market structure and flows aligning with the template rather than on narratives alone. A durable uptrend would typically feature higher highs and higher lows through major resistance, sustained demand via spot ETF channels, and the price holding above long‑horizon baselines such as the 200‑week moving average. Conversely, breakdowns below recent supports, persistent ETF outflows, or macro/regulatory shocks would argue the fractal is not in force.
What the Bitcoin bottom fractal is and why it matters
In market analysis, a “fractal” describes recurring structural patterns across cycles. For Bitcoin, the bottom‑fractal idea maps post‑halving supply reductions, consolidation, and subsequent trend resumption onto current conditions. The appeal is that it converts a complex cycle into checkpoints, accumulation, breakout, retest, and expansion, without relying on precise forecasts.
It matters because it provides a transparent set of conditions that can be monitored. According to BlackRock Digital Assets, volatility has persisted since an autumn peak, yet longer‑term pillars, growing institutional participation, maturing regulation, and Bitcoin’s finite supply, help explain why a cyclical bottom framework remains under discussion. That macro‑micro alignment is necessary, but it still needs technical confirmation in price and liquidity.
Immediate impact: key levels, spot ETF flows, risk signals
At the time of this writing, Bitcoin trades near $66,729, within a six‑month range of roughly $60,096 to $126,230; trend gauges show the 50‑day simple moving average around $79,015 and the 200‑day near $97,914, while the 14‑day RSI sits near 39 and realized volatility around 7.9%. These figures, based on data from Yahoo Finance, frame a market that is consolidating below longer‑term trend measures.
Near term, resistance is clustered in the mid‑$90,000 to low‑$100,000 region with supply overhead closer to the prior high, while supports are discussed in the $80,000–$95,000 area. Spot Bitcoin ETF net flows have been uneven, with episodes of outflows even during price strength, as reported by AInvest; sustained, broad‑based inflows would improve the probability that the fractal path is taking hold.
Institutional views are mixed, reflecting that tension between pattern and proof. Bernstein analysts said crypto markets “have bottomed,” citing a late‑2025 low as the likely cycle floor. By contrast, David Solomon, CEO of Goldman Sachs, described Bitcoin as a “speculative investment” and noted he holds only a “very limited” amount, a stance that underscores the need for stronger technical and liquidity confirmation before declaring a durable trend.
Validation and invalidation: supports, resistance, and 200-week moving average
For validation, watch for acceptance above the 50‑day and then the 200‑day moving averages, sustained closes through the mid‑$90,000 to low‑$100,000 resistance band, and constructive spot ETF net inflows that persist beyond short squeezes. Holding above the 200‑week moving average would further strengthen the cyclical bottom case by aligning price with a long‑term uptrend baseline. On‑chain gauges often cited in these debates, such as MVRV or spending‑profit ratios, would ideally turn supportive alongside price structure.
For invalidation, repeated rejections at noted resistance zones, lower lows back through the mid‑$80,000s to low‑$90,000s, or prolonged ETF outflows would erode the fractal thesis. Macro tightening or adverse regulatory developments could add downside pressure and delay any attempt to re‑establish an uptrend. In short, the 2026 bottom‑fractal remains a testable hypothesis: plausible, but awaiting confirmation from price, positions, and policy.
| Disclaimer: This website provides information only and is not financial advice. Cryptocurrency investments are risky. We do not guarantee accuracy and are not liable for losses. Conduct your own research before investing. |