

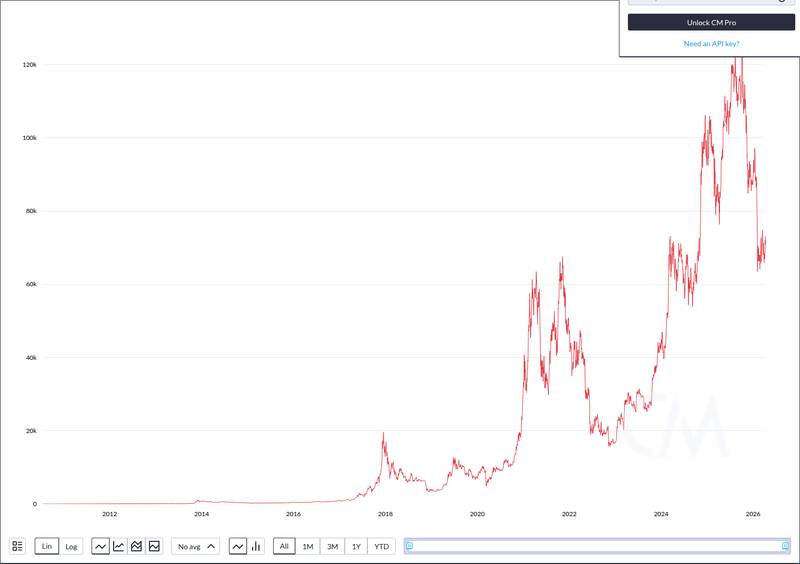
Bitcoin climbed back above $74,000 on April 14, 2026, recovering roughly 5.66% in 24 hours as a streak of U.S. spot ETF inflows injected over $1 billion in fresh demand across three trading sessions, even as large-scale miner selling continued to weigh on the rally.
What drove Bitcoin back above $74K
Bitcoin traded at $74,647 at press time, marking a sharp rebound from levels below $70,000 seen earlier in April. The move followed a concentrated burst of institutional buying through regulated ETF vehicles.
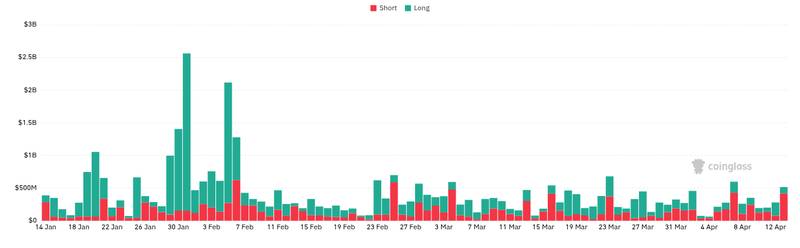
U.S. spot Bitcoin ETFs recorded $471.4 million in net inflows on April 6, followed by $358.1 million on April 9 and $256.7 million on April 10. That three-session total of roughly $1.09 billion represents one of the strongest short-term demand signals since the products launched in January 2024.
The rebound is notable given that Bitcoin had failed to hold $70,000 just days earlier despite similarly strong ETF activity, a pattern that points to persistent selling pressure on the supply side. The latest ETF netflow data showed daily inflows exceeding 3,300 BTC, reinforcing the demand-led nature of the current move.
How miner selling is still capping the rally
The demand from ETF buyers has not gone unchallenged. MARA Holdings, one of the largest publicly traded Bitcoin miners, disclosed that it sold 15,133 BTC between March 4 and March 25 for approximately $1.1 billion. The proceeds funded a repurchase of convertible senior notes due 2030 and 2031.
That single disposal by MARA exceeded the combined ETF inflows from any individual session in the April streak. When combined with selling from other public miners and digital-asset treasury firms, the supply-side pressure explains why Bitcoin’s recovery above $74,000 remains contested rather than decisive.
Cointelegraph reported on April 7 that Bitcoin failed to hold $70,000 despite the $471 million ETF inflow day because selling by public miners and treasury firms offset the buying. The current rebound above $74,000 suggests ETF demand has, at least temporarily, absorbed the available supply, but the structural clash between institutional accumulation and miner liquidation is far from resolved.
What to watch after the rebound
Despite Bitcoin’s sharp bounce, broader market sentiment remains deeply cautious. The Fear and Greed Index sat at 12 at fetch time, a reading classified as Extreme Fear. That disconnect between price action and sentiment suggests the rally has not yet convinced the wider market.
Daily ETF flow data has become the clearest near-term confirmation signal for whether institutional demand can sustain this recovery. Since U.S. spot Bitcoin ETFs began trading in January 2024, their net flows have served as one of the most transparent regulated-demand gauges in public crypto markets.
If inflows continue at the pace seen on April 6, 9, and 10, the current rebound has a measurable demand floor beneath it. If flows reverse, the same miner-led selling pressure that capped Bitcoin below $70,000 earlier this month could reassert itself. Developments in adjacent markets, including Ondo Finance’s push for SEC approval of tokenized equities on Ethereum, may also shape broader institutional appetite for digital assets in the weeks ahead.
Disclaimer: This article is for informational purposes only and does not constitute financial or investment advice. Cryptocurrency and digital asset markets carry significant risk. Always do your own research before making decisions.