
The total altcoin market capitalization slipped below $1 trillion on February 23, 2026, for the second time in less than a week, as President Trump’s threat to impose a 15% global tariff on all goods entering the United States triggered a broad selloff across digital assets.
The broader crypto market retreated approximately 3% on the session, with altcoins bearing the brunt of the decline. Bitcoin dominance climbed to 55.87%, reflecting a sharp risk-off rotation away from smaller-cap tokens and into BTC.
The total crypto market cap stood at $2.35 trillion as of late March, but the altcoin segment (excluding Bitcoin) hovered near the $1.037 trillion mark, underscoring how fragile confidence remains outside the largest digital asset.
ETH, SOL, XRP, and BNB Post Sharp Single-Day Losses
Ethereum led the altcoin losses in absolute terms. ETH plummeted 4.5% from $1,957 to a session low of $1,856, erasing roughly $8.4 billion from its market cap and pushing it down to $227 billion. The token had already fallen over 20% since the start of February, making the February 23 drop part of a broader downtrend rather than an isolated event.
Solana fell nearly 7% to a 10-day low of $77.36, marking a 36% year-to-date decline. For a token that traded above $120 at the start of January, the slide represents a sustained repricing that mirrors what Bitcoin holders experienced during previous drawdowns.
XRP dropped more than 3% to $1.34, reversing a midmonth surge that had pushed the token to $1.64. BNB dipped below the critical $600 threshold with a comparable 3%-plus daily decline. BCH and HYPER each shed approximately 5%.
The losses were not confined to a single sector. Layer-1 tokens, exchange tokens, and alternative payment networks all declined in tandem, suggesting macro-driven selling rather than project-specific weakness.
13 Months of Net Selling Signal Structural, Not Cyclical, Weakness
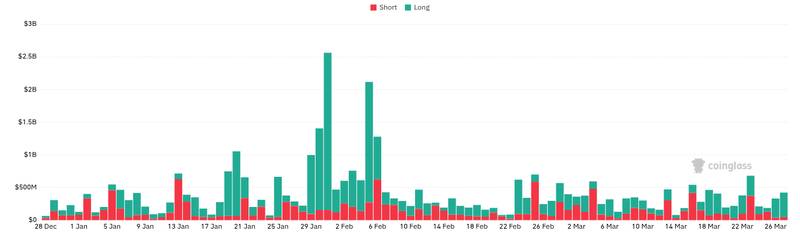
The February 23 selloff did not occur in isolation. According to CryptoQuant data cited by BeInCrypto, altcoin selling pressure (excluding BTC and ETH) has reached a 5-year extreme, with the cumulative buy/sell delta hitting negative $209 billion over 13 consecutive months of net selling on centralized exchange spot markets.
That figure points to a sustained bear phase for altcoins, not a single-event dip triggered by tariff headlines. While Trump’s 15% tariff threat served as the immediate catalyst, the structural outflows suggest investors have been steadily reducing altcoin exposure since early 2025.
This structural context matters for understanding where the market stands now. The last time altcoin market cap traded meaningfully below $1 trillion was during the 2022-2023 bear market, when the collapse of FTX and the Terra/Luna implosion wiped out confidence across the sector. The current environment differs in key ways: spot Bitcoin ETFs now channel institutional capital, and stablecoin supply has grown, but the net-selling data suggests those tailwinds have not extended to altcoins.
One notable divergence: Asian equity markets rallied on the same session. The Hong Kong Hang Seng rose 2.53%, climbing roughly 660 points to 27,081. The fact that traditional risk assets in Asia gained while crypto sold off highlights the digital asset market’s unique sensitivity to U.S. trade policy uncertainty.
Extreme Fear Persists as Traders Eye Key Levels
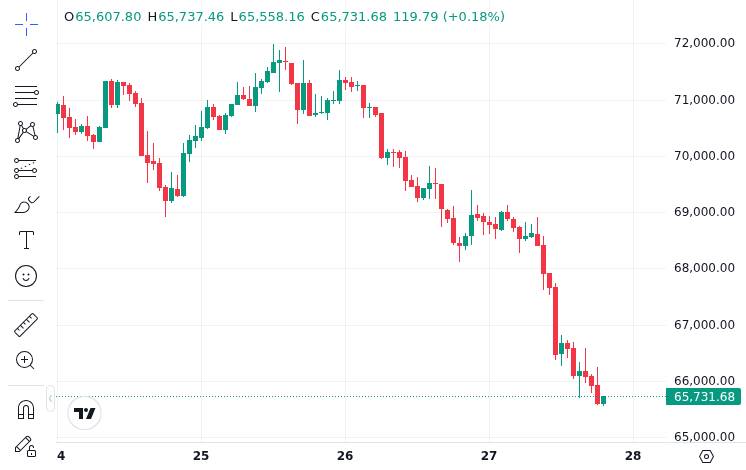
The Bitcoin ETF outflow pattern that resumed in late March compounds the bearish picture. The Fear & Greed Index sat at 13 as of March 27, 2026, firmly in “Extreme Fear” territory, a reading that has persisted for weeks rather than spiking and recovering.
For ETH, the $1,800 level represents the next major support zone that traders are watching. A sustained break below that level would mark ETH’s lowest price since late 2023. Solana faces a similar test near $75, while XRP’s reversal from $1.64 to $1.34 opens the possibility of a retest of $1.20 if macro headwinds continue.
On the macro calendar, upcoming U.S. trade policy decisions remain the primary catalyst. Trump’s tariff threats have moved from rhetoric to specific proposals, and any formal announcement of the 15% global tariff could trigger another leg lower for risk assets. The next Federal Reserve policy meeting also looms as a potential volatility event.
The broader crypto infrastructure continues to develop even during drawdowns, but for altcoin holders, the data paints a clear picture: 13 months of net selling, a 5-year extreme in outflow pressure, and a Fear & Greed reading of 13 leave little room for near-term optimism without a concrete macro catalyst to reverse the trend.
Disclaimer: This article is for informational purposes only and does not constitute financial or investment advice. Cryptocurrency and digital asset markets carry significant risk. Always do your own research before making decisions.